← All work
● DeployedMulti-agent pipeline

Amazon Discovery Intelligence

Reads a week of customer complaints and says what to work on Monday. It names the first move, who owns it, and what it will cost. It reads reviews people posted publicly about an app I do not work on.

Platform
TypeScript on Cloud Run
Stage
Deployed, scheduled
Method
Built on a fixture, run on live data
ProblemA PM cannot read every review, so they skim. Skimming feels fine, because you never find out what you missed.
DecisionA ranked list hands the queue back to the PM. So the score is small print, and each problem leads with a finding, a first move and a price.
Evidence299 complaints in the latest week, sorted into 33 problems across 7 parts of the app. Every claim links to the review behind it.
OutcomeOne problem out of 33 had enough behind it to act on, and the page says so plainly instead of ranking all 33.
The week at a glance: 500 complaints read, 33 problems found across 7 parts of the app, 32 of them not yet safe to act on, and 23 that cost people money. A coloured bar shows which part of the app each complaint came from. Below it, the one problem with enough behind it to act on.
A week in one screen, and the one problem worth opening first.
The chat view, scoped to all groups for week 34 on live data. It offers three questions to start with — the top complaints this week, which themes are worsening, and how ready this group is to act on — and states that answers cite specific signals by ID.
Ask the week a question. It answers only from the signals in scope, and cites them.
This week’s ranking

From a visual workflow to hosted code

The first buildAn n8n workflow. Twenty-nine nodes on a visual canvas, doing the right thing. Take reviews, clean them, find themes, score them, email a digest.
What brokePutting it behind a website means it has to be running somewhere. Either I leave my machine on, or I pay for hosting. I did not want either for a portfolio project.
The moveEvery node became a TypeScript module. The canvas became an orchestrator.
Who did the portI used Claude for it. Twenty-nine nodes of settled logic, translated rather than reinvented.
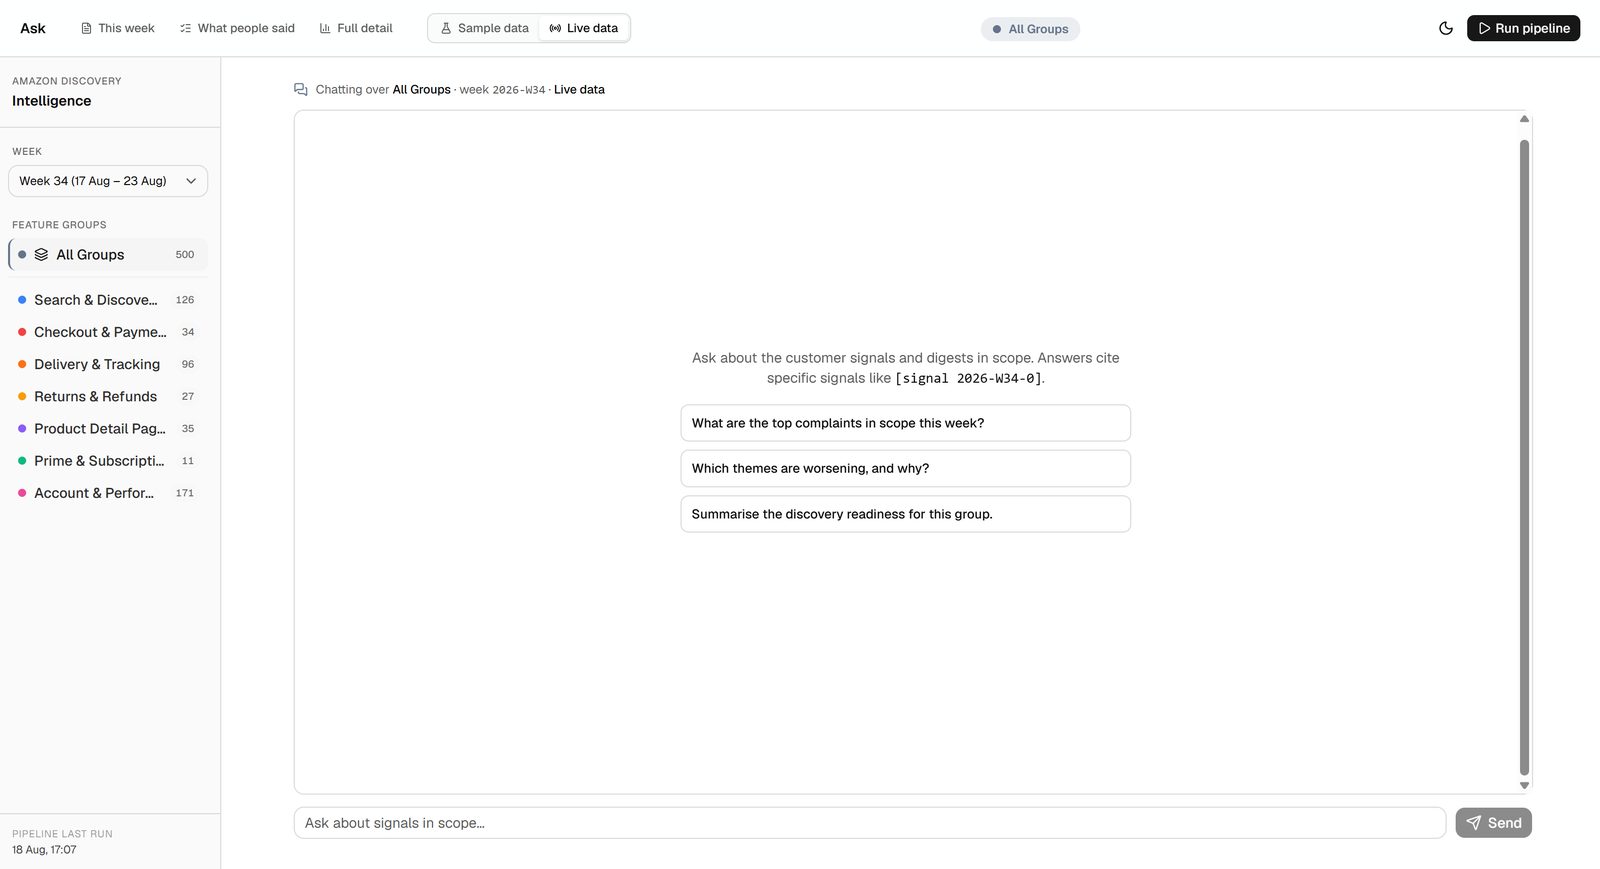
The pipeline’s chat view before a question is asked. The header names the group, the week and whether the data is live or a sample. The empty state says answers cite specific signals, and shows the citation format.
The chat opens scoped to one week of live data, and says up front that every answer cites the signals it used.

How it works

Fourteen steps in sequence. The model runs at four of them. Every number a PM then sees is counted in code, and that split is the thing I got wrong first.

What AI doesIt reads messy review text, groups complaints into problems, and works out what to do about the biggest ones. Reading a thousand badly written complaints and noticing four hundred are the same problem is exactly what a model is good at.
What code doesEvery count. How many people raised a problem, how many stores it came from, the score, the week-over-week change. Arithmetic, which a model is not good at and does not need to be.
Why the splitI drew the line in the wrong place at first. The readiness step was asked to grade how many people raised a problem, which I had already counted exactly. It said “only one person reported this” beside the number 53. Never ask a model to judge what you have already counted.
The chat tooIt cites sources as signal IDs, and every citation is checked against the real signals before it renders. An ID that does not resolve gets an amber unverified chip instead of a footnote that looks real.
Fourteen pipeline steps, four of them AI The pipeline runs fourteen steps in sequence. The model runs at four: cleaning messy review text, grouping complaints into themes, judging how strong the evidence is, and working out what to do about the biggest problems. The other 10 are code, including every count. THE PIPELINE, IN ORDER 01 Load signals 02 Normalise 03 Clean signals AI 04 Detect regressions 05 Regression email 06 Synthesise themes AI 07 Write signals 08 Read digests 09 Aggregate by group 10 Count the evidence 11 Assess readiness AI 12 Diagnose the top problems AI 13 Write digest row 14 Send digest Every number a PM sees comes from the other 10.
The model reads and groups. It never counts. A model is good at noticing four hundred complaints are the same problem, and bad at arithmetic — and arithmetic is what a PM has to defend in a roadmap meeting.

Trade-offs

Three calls. Each gave something up, and each bought something worth more.

A spreadsheet over a databaseIt writes to a Google Sheet. I gave up queries and schema control, and got a store PMs already sort, filter, comment on and share. Postgres was about ₹1,100 a month to hold seven rows a week; Cloud Run scale-to-zero does it for ₹40.
Their schema over mineThe sheet was built before the code, and the two disagreed. I changed the code rather than the sheet — including leaving a misspelled column header alone, because a PM may already be filtering and pivoting on it.
The question over the archiveThe first version made each weekly run the thing you clicked between. I gave up the history view. Nobody asks what happened in week 22; they ask what is going wrong in Checkout.

The part I did not expect

I built three places to collect reviews from. Two send back almost nothing, and I found out once it was live.

App StoreApple blocks requests from rented servers. It answers as if nothing is wrong and sends an empty list; the same code on my laptop returns fifty reviews.
Amazon itselfThe US pages are almost all praise, so the complaint filter drops nearly everything. The India pages ask the machine to prove it is human.
What is leftThe Play Store. Fifty reviews a run, thirty-two of them specific enough to analyse.
The lessonEvery pipeline diagram starts with an arrow labelled data. The arrow is the hard bit.

Who already built this, and what mine does after

Big companies ship a version of this and publish what it saved them. The shape is settled. The argument is about what happens once the complaints are grouped.

It worksAtlassian says its PMs save about 40 minutes a day to an agent reading their feedback queue. Dovetail and Amplitude sell the same clustering to Canva, Meta and NTT DOCOMO.
Where they stopThey return a ranked list of themes. A ranked list is still a backlog, and whoever opens it starts prioritising from scratch.
What this addsEvery problem ships with a first move, an owner and a rough cost. When one of 33 is ready, the page says so instead of ranking all 33.
Why you can check itThe model reads and groups. Code does every count. Every number traces to the reviews under it, one citation at a time.

What the evidence supports

No product manager has run a week through this one yet. That is not the same as having no evidence. Here is the case the published numbers already make.

The category is provenAtlassian says its PMs save about 40 minutes a day to an agent reading their feedback queue. Dovetail and Amplitude sell the same clustering to Canva, Meta and NTT DOCOMO.
Where this one differsAll of them stop at a ranked list of themes, and the PM still has to open it and decide. This one names the first move, the owner and the price. That is the step after the one they automate.
What that predictsOn the same inputs it should land in the same range, and take back the hour a ranked list hands straight back to the reader. Inference from comparable products, not a measured result from this one.
What would settle itWhether the named first move gets taken. The digest already carries a feedback link, so that number is one week of real use away rather than a research project.
Which numbers are whichThe design was proved on a fixture of 140 signals I wrote. The limits came from live runs, smaller and messier and uneven across three sources. Both are honest. Only one is real.